My Godfather Ran the Met Office. He Warned Me About This 30 Years Ago.
A mountain fell on the Nepal–Tibet border and the question arrived before the mud had settled — was this climate change? The honest answer takes thirty years, two supercomputers, one Royal Navy ice patrol ship and a warning my godfather put on the public record in 1999.
The prologue to this piece is The Day the Mountain Moved. This is the long version.
At approximately 8.37am on 26 August 2026, a piece of the Himalayas let go.
I should be more precise, because precision is rather the point of this article. High on the Nepal–Tibet border, an enormous section of glacier and the rock beneath it detached from the mountain and fell — satellite analysis suggests by around 1,200 metres — into the valley below. What arrived at the bottom was no longer a glacier. It was a moving wall of ice, rock, water and sediment, and it went down the river system the way a fist goes through wet paper. River levels reportedly rose nine metres in about half an hour.[2]
The thing was so violent that seismometers registered it as an earthquake. The US Geological Survey later concluded there had been no earthquake at all. The ground had shaken because a mountain had fallen on it.[2]
As I write this on 27 August, rescuers are still searching through the devastation. At least 359 people are confirmed dead and more than 1,000 remain missing. Villages, roads, bridges and power infrastructure have been swept away.[1]
And inevitably, before the mud has settled, the question has followed:
Was this climate change?
I want to answer that properly, which means slowly, and it means going back a little over thirty years — to a conversation with a man who, as it happens, was rather well placed to have an opinion.
My godfather was Peter Ewins — godfather in the full sense, for the whole of my life, rather than a name written once on a certificate and never heard from again.
Peter became Chief Executive of the UK Met Office in 1997 and led it until his retirement in 2004. Before that he had been Chief Scientist at the Ministry of Defence, which is the sort of job title that makes people at dinner parties go quiet and ask what one does, exactly.[4][6]
In the 1990s, Peter warned me about what climate change could eventually mean.
I remember him talking about the climate models the Met Office was running on its supercomputers. What struck me was not the excitement one might expect about what the machines could do — the man had spent a career around large, expensive computers and was well past being impressed by them. It was how seriously he took what they were showing. He told me that if the warming continued, the consequences would not simply be a warmer world. They could become catastrophic.
He was not talking about warmer summers. Not about the prospect of a passable English sparkling wine (which has, admittedly, arrived). Not the cosy, cartoon notion of a world a couple of degrees warmer, as though the planet were a bath that had been run slightly too hot.
He was talking about something far less comfortable, and he used a word I have never forgotten.
Destabilisation.
The idea is almost embarrassingly simple once you see it. The Earth is not a collection of separate things — an atmosphere here, an ocean there, some ice on top for decoration. It is one system, with energy flowing through it, and everything in it is connected to everything else by the plumbing of physics. Change the temperature and you have not adjusted one dial. You have nudged all of them.
Ice.
Water.
Rainfall.
Oceans.
Soil.
Permafrost.
Agriculture.
Ecosystems.
Weather.
And eventually, things we had always assumed were stable stop behaving as though they are.
At the time, I confess, it sounded almost impossibly distant — the kind of thing that happens in a documentary narrated by somebody with a very calm voice.
And yet I had already stood on the ice.
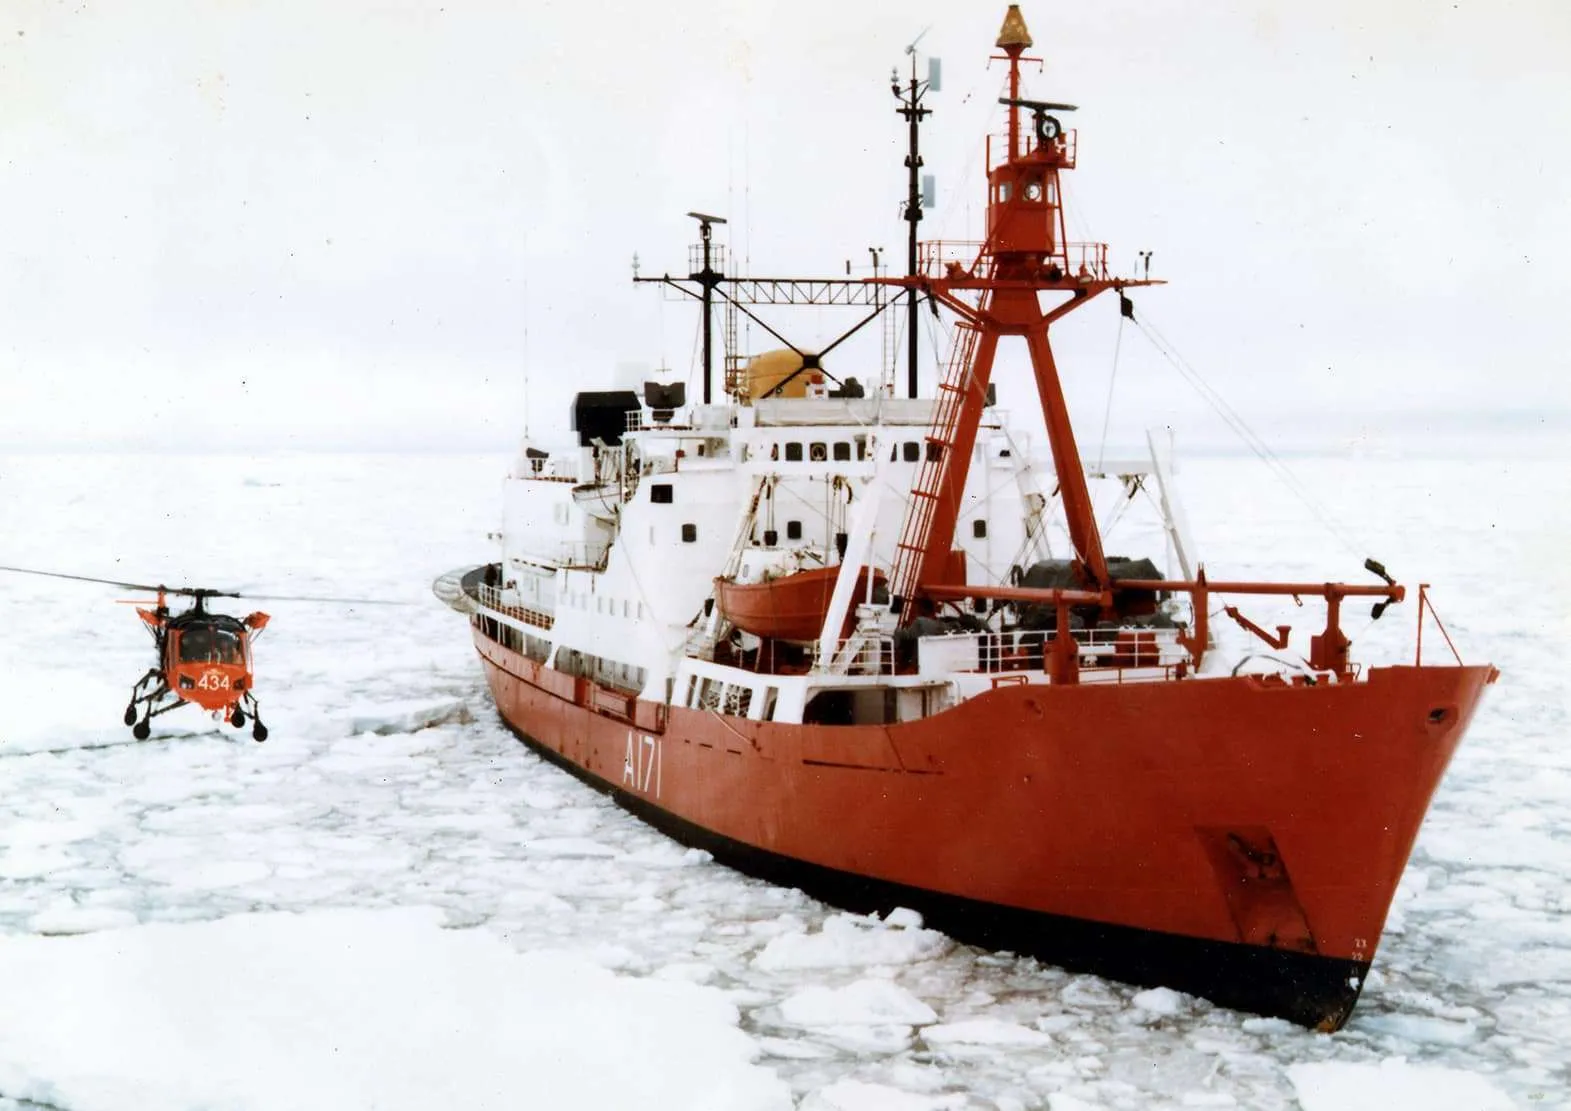
At more or less the time these conversations were happening, I was in the Antarctic myself. I served aboard HMS Endurance — the Royal Navy’s ice patrol ship, red hull, one small helicopter, a great deal of pack ice — on her 1990–91 deployment. I make no scientific claim from that; I am not a glaciologist, and one man’s memory of a coastline is not a dataset. But I carry a clear picture of what that landscape looked like from the deck of a ship that was sitting in it, and I have watched it since the only way most of us can: through decades of documentaries, satellite imagery and the official record of the continent’s changing ice. The ice I saw is not the ice that is there today. The difference is not subtle, and it is not a matter of interpretation. It has been measured, repeatedly, by people with instruments.
You do not, of course, need to have been to Antarctica. Find an ageing taxi driver in Singapore or Bangkok and ask him whether the monsoon still turns up when it used to, whether the heat is what it was when he started driving, whether the rains behave themselves the way they did. I have never met one who said nothing had changed. That is not science either. But when the anecdotes of ordinary people, the memories of travellers and the instruments of every meteorological agency on Earth all point the same way, it is reasonable to ask which side of the argument is now carrying the burden of proof.
Today, when I look at Nepal, I remember those conversations.
The machines were already telling us
There is something worth noticing about the period in which those conversations took place.
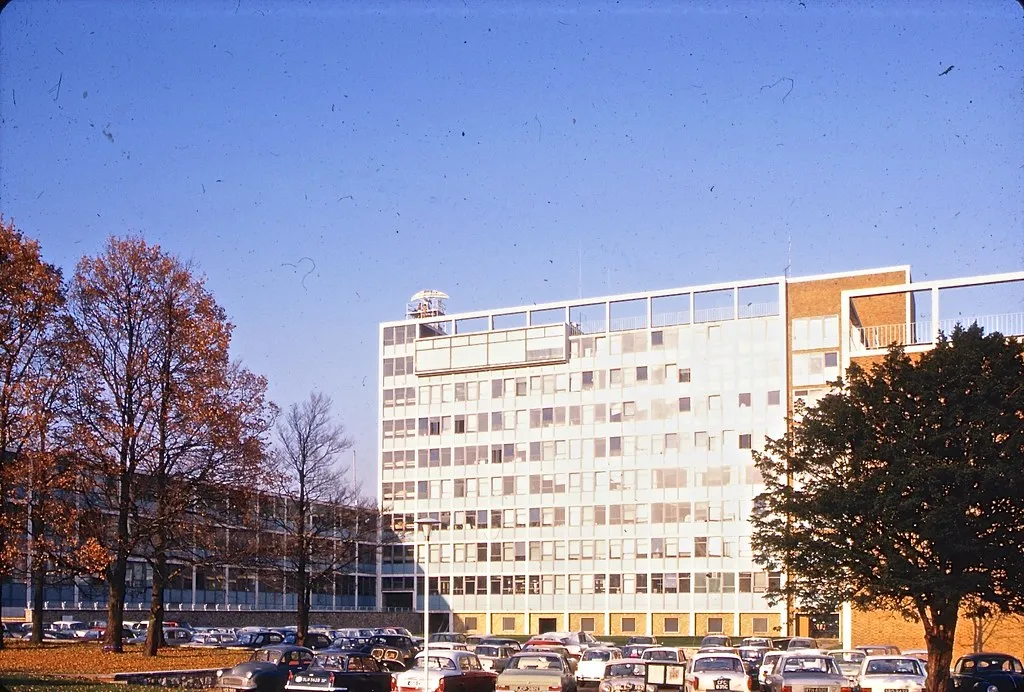
The Met Office Hadley Centre for Climate Prediction and Research had been established in 1990. At roughly the same time, the Met Office was building what became its Unified Model — a single piece of architecture that would do both weather forecasting and climate simulation, on the sensible grounds that the atmosphere does not know the difference. In June 1991 that model went operational on a Cray Y-MP-8 supercomputer capable of about one billion calculations per second. The following year, the Department of the Environment paid for a second Cray specifically for the Hadley Centre’s climate work.[17]
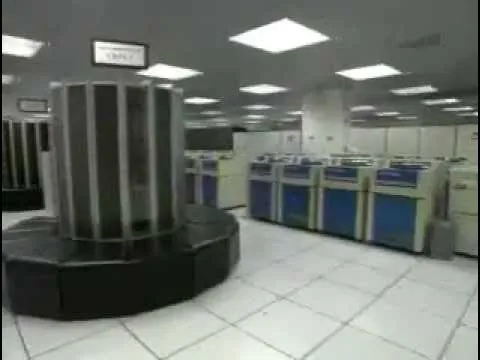
A billion calculations a second. At the time, this was the frontier. Today it is roughly what your phone does while deciding whether to show you an advertisement.
But those machines were being asked a question of real grandeur:
What happens if we change the chemical composition of the atmosphere and then let the physics run forward for a century?
They were not, I should say at once, forecasting that a particular glacier above a particular Nepalese valley would collapse at 8.37am on 26 August 2026. They couldn’t have. HadCM2, developed by the Hadley Centre in 1995 and used in the IPCC’s Second Assessment Report, chopped the atmosphere into grid cells roughly 417 by 278 kilometres at the equator. An entire Himalayan valley vanished inside a single pixel.[9]
But predicting individual disasters was never the point.
The models were predicting the changing conditions in which disasters occur.
That distinction is the hinge on which this whole article turns, so I’ll ask you to hold on to it.
Before the computer came the observations
There is another part of the story that tends to go missing when people talk about climate models, and it deserves rescuing.
The computers did not invent the climate. They were fed observations of the real one — gathered, at considerable inconvenience, by ships, aircraft, weather stations, balloons, satellites and human beings stationed in some of the least hospitable places on the planet, all of them measuring temperature, pressure, wind, ice and ocean, day after day, for decades.
One rather beautiful example sits in the British parliamentary record.
During her 1989–90 Antarctic deployment, the Royal Navy ice-patrol vessel HMS Endurance (A171) spent around 100 days in or near Antarctic waters and logged 350 sets of meteorological observations. Those observations were sent to the Met Office. And when Parliament asked what became of the data, the answer was refreshingly plain: observations from Endurance, combined with information from Antarctic research stations and longer-term records, were being used by the Met Office in “weather forecasting and climate prediction work.”[7]
I should declare an interest here, because it is the reason that dry parliamentary answer affects me the way it does. The deployment described in Hansard is the season immediately before mine. I joined Endurance for 1990–91, and we did the same job in the same water: the same observations, logged in the same way, sent to the same building in Bracknell. At the time it felt like paperwork. It was, in the least glamorous sense available, science.
So the chain already existed, more than thirty-five years ago:
observe the planet → build the record → encode the physics → run the model → test the prediction against what happens next.
Endurance was not merely flying the flag in the South Atlantic. She was helping build the dataset against which a changing climate could later be measured. And the relationship went on: in 1997–98 her successor traversed the enormous Ronne Polynya in the Weddell Sea, collecting sea-ice, oceanographic and meteorological measurements that scientists used alongside satellite data for numerical modelling experiments.[18]
The machines mattered.
But so did the thermometer on the ship.
Peter put the warning on the record
My recollection of Peter warning me is personal, and personal recollections are, as any lawyer will tell you, worth roughly what you paid for them. What makes this one worth more is that we don’t have to rely on it.
He said it publicly.
In December 1999, Peter Ewins, then Chief Executive of the Met Office, and Dr James Baker, head of the US National Oceanic and Atmospheric Administration, issued a joint warning about climate change. They pointed to the emerging evidence that the warming being observed could not be explained without accounting for human-generated greenhouse gases and aerosols. They told governments and businesses that action was needed. They spelled out the likely consequences — more extreme weather, rising sea levels, changing rainfall, ecological disruption, impacts on agriculture and human health.[5]
And they closed with a sentence that reads rather differently now than it did in 1999:
“Ignoring climate change will surely be the most costly of all possible choices, for us and our children.”[5]
Peter later told the BBC that the evidence for a human influence on climate was becoming almost incontrovertible, and that society therefore needed to act.[19]
That was twenty-seven years ago.
I labour this because there is a persistent notion that climate scientists keep moving the goalposts. They don’t. The computers changed, the resolution changed, the observations improved beyond recognition, and the models became enormously more sophisticated. The warning survived all of it, unaltered in substance. In the same year Peter signed that letter, the Met Office produced HadCM3 — a model that could hold a realistic climate steady without the artificial “flux adjustments” earlier coupled models had needed, and which went on to become a workhorse for detecting and attributing historical change.[9]
The awkward question: were those old models actually right?
Here is where the argument becomes properly interesting, because thirty years have passed, and thirty years is enough. We no longer have to wonder whether the models of Peter’s era might have worked.
We can mark their homework.
In 1988, James Hansen and colleagues at NASA published one of the best-known early three-dimensional climate-model studies. The model was crude by modern standards — a grid of roughly 8° latitude by 10° longitude, which is to say squares about the size of Spain — yet it projected that greenhouse warming would become clearly detectable during the 1990s and would produce temperature changes large enough to matter to human societies and the biosphere.[20]
The first IPCC assessment followed in 1990. Under its business-as-usual assumptions it projected warming of about 0.3°C per decade, with a stated range of 0.2°C to 0.5°C.[21]
By 2007 enough time had elapsed for the IPCC to do something scientists rather enjoy: check. Projections in the first and second assessments for 1990–2005 had suggested warming of roughly 0.15°C to 0.3°C per decade. The observed rate was about 0.2°C per decade. The IPCC said, in as many words, that the comparison strengthened confidence in near-term projections.[22]
Then came a bigger test. In a 2020 paper in Geophysical Research Letters, Zeke Hausfather and colleagues took climate models published between 1970 and 2007 and compared their projections with what the planet actually did. Their conclusion was not that every number was perfect — it was more useful than that. The models were generally skilful at predicting subsequent global warming, particularly once you accounted for the difference between the emissions scientists had assumed and the emissions humanity went on to produce.[10]
That last qualification matters enormously, and it’s worth a moment. A climate model is not a crystal ball. It is a physics engine, and you have to tell it what humans will do: how much carbon dioxide, how much methane, which volcanoes, how much aerosol pollution, how economies grow. Get the human behaviour wrong and the temperature trajectory moves. That is not the physics failing. That is the physics faithfully reporting on a different input.
And so we arrive at what I think is the single most under-appreciated fact in the whole debate: we have already run a thirty-year, out-of-sample experiment on the earlier generation of models.
The models made predictions.
Time passed.
Nature supplied the test data.
And broadly, the warming appeared where the physics said it would.
Now look at the Himalayas
This is where I have to be careful, because the temptation to be dramatic is strong and dramatic is not the same as true.
It would be scientifically irresponsible to look at the devastation in Nepal and simply declare that climate change caused this glacier to collapse. The scientists studying the event are not saying that. There have been too few enormous glacier-collapse events to establish a tidy statistical relationship between warming and this particular mechanism, and there may have been several contributing factors: rock stability, ice dynamics, water, recent weather, the geometry of the mountain itself. Whether human activity on the slopes — road cutting, hydropower works — played any part is a question for the investigators, not for me.
Science should be allowed to establish those facts rather than being frog-marched into a headline.[3]
But there is a quite different proposition, and for that one the evidence is considerably stronger:
Climate change is altering the physical environment in which these events occur.
According to the International Centre for Integrated Mountain Development (ICIMOD), the Hindu Kush Himalaya is warming faster than the global average, and glacier loss across the region accelerated sharply between 2011 and 2020 compared with the decade before. ICIMOD’s figures for Nepal suggest the country’s mountains have lost close to a third of their ice in a little over thirty years.[11][3]
And warming reaches well below the visible surface of a glacier.
Consider permafrost — a rather unglamorous word for something doing an enormous job. High in the mountains, frozen ground acts as a kind of glue, cementing steep slopes of fractured rock and ice into a single structure. Warm it, and the glue softens. Structures that have stood since before there were humans to look at them can, quite suddenly, stop being structures.
We have seen this before, recently and not far away. In February 2021, a mass of rock and glacier ice — roughly 27 million cubic metres of it — detached from Ronti Peak in Uttarakhand, India, and fell nearly two kilometres. It produced a seismic signal, a wall of debris and water that destroyed two hydropower projects, and around 200 deaths. The scientific reconstruction published in Science later that year was careful not to attribute that individual collapse to climate change. But it identified exactly the wider mechanisms that concern scientists today: long-term thermal disturbance of permafrost, retreating glaciers, changing stresses within the mountain and increased meltwater infiltration during warm periods.[12] Later work found the slope had been deforming for years, and implicated a combination of snow loading and degrading permafrost.
Chamoli was not proof that climate change causes every mountain collapse. It was evidence of what a destabilising high-mountain system can do — and, set beside the historical record of glacier disasters, part of a list that is not getting shorter.[16]
Glaciers retreat.
Ice turns to water.
Water finds new paths.
Rock becomes exposed.
Glacial lakes appear and expand.
Slopes change.
Freeze-thaw patterns change.
The probability landscape changes.
And gravity — this is the part I find almost unbearably elegant — remains exactly the same. It is the one constant in the story. It does not negotiate, it does not read the newspapers, and it has all the time in the world.
That is the connection.
Climate change does not have to be the finger that pushes the first rock over the edge.
It can change the entire mountain the rock is sitting on.
This is what Peter was trying to explain
Looking back, I think this is what Peter wanted me to understand.
Climate change was never really about the number on the thermometer. The temperature was the input. The consequences were the output.
And the genuinely frightening part was not some computer-rendered apocalypse. It was that underneath the simulations sat ordinary, well-understood physics — the sort of thing one can, with a following wind, explain to a teenager. We knew what greenhouse gases did. We knew that adding more of them changed the Earth’s energy balance: slightly more energy arriving than leaving, year after year, with nowhere for the difference to go but into the system. We knew that warming would affect ice, oceans, rainfall, hydrology. The supercomputer’s job was simply to hold all of those pieces in its head at once and ask the question no human could: what happens next?
There was uncertainty. Of course there was; there still is. Climate sensitivity had uncertainty. Clouds had uncertainty. Aerosols, ocean circulation, regional effects — all uncertain, some of them enormously so.
But somewhere along the way we made a profound intellectual mistake, and it is the kind of mistake that is easy to make and very hard to un-make.
We confused:
uncertainty about precisely what would happen
with
uncertainty about whether anything would happen.
Those are not remotely the same thing. If you are told the bus will arrive sometime between ten past and half past, you do not conclude that there is no bus.
From a billion calculations to sixty quadrillion
The technological change since Peter’s era is almost absurd, and it deserves to be dwelt on.
When the Unified Model went live on that Cray in 1991, a billion calculations per second was formidable, and the people using it were attempting something of genuine ambition: to model the behaviour of an entire planet.
In May 2025 the Met Office moved its operational weather and climate intelligence onto a new Microsoft-operated cloud supercomputing system, which it says is capable of more than 60 quadrillion calculations per second across roughly 1.8 million compute cores.[8] On raw headline speed, that is about 60 million times the machine of 1991. If the Cray was a bicycle, this is something that arrives before you have finished deciding where to go.
But speed is only part of it. Resolution has improved. Satellite coverage, ocean observation and data assimilation have improved. The representation of clouds, aerosols, ice sheets, vegetation, ocean circulation and atmospheric chemistry has improved. Rather than asking only what happens to global mean temperature, researchers can now interrogate rainfall extremes, individual catchments, coastlines, drought probability, storm tracks and regional risk. The Met Office is redesigning the next generation of its modelling architecture to exploit massively parallel, heterogeneous computing, with future systems intended to represent atmosphere and ocean at still finer grain and capture extreme events more effectively.[8] Europe is going further still: the Destination Earth programme’s climate adaptation digital twin is running 1990–2049 at roughly five-kilometre resolution, hour by hour, for atmosphere and land.[13] The Himalayan valley that once vanished inside a single pixel now has a few hundred of its own.
And another kind of computation has walked into the room: artificial intelligence. In July 2026 the Met Office and the Alan Turing Institute reported results from FastNet, their experimental machine-learning weather model. Its performance is already comparable with the Met Office’s conventional Global Model on a number of measures, and better on some.[14]
So the future looks hybrid: physics + observations + supercomputing + AI.
And quantum? Possibly another step — but let us be exact, because exactness is cheap and hype is expensive. Nobody should read this article and conclude that today’s climate projections are being generated by quantum computers. They are not. Researchers are exploring whether quantum systems might one day accelerate particular pieces of the problem: solving differential equations, representing processes too small for a model grid, optimising parameters, analysing vast ensembles. A 2025 review in Environmental Data Science describes real possibilities and equally real unsolved problems — hardware, error, data encoding, read-out, integration with classical machines.[23] Oxford’s Tim Palmer and colleagues have cautioned that quantum computers are unlikely simply to replace classical forecasting supercomputers; their plausible role is as specialists inside a larger heterogeneous system.[24]
We do not need science fiction. What conventional computing has already achieved is extraordinary enough.
We are no longer in the era of coarse warnings. We are in the era of real climate prediction.
And here is the thing I find hardest to square: we trust exactly this kind of computation everywhere else.
We trust it to run the world’s stock exchanges, where algorithms trade in microseconds and nobody suggests the mathematics is a hoax. We trust it in the theatre of war, where the same modelling that simulates an atmosphere guides missiles and plans campaigns. We trust it in medicine, where a scan interpreted by a model can decide whether a tumour is cut out or left alone. In each of those domains, ignoring what the computers tell us would be called negligence, and somebody would be sued.
Only in climate do we treat the output as an opinion.
And yet one of the strangest arguments still survives, usually delivered with a knowing air:
Perhaps the scientists don’t really know.
So it is worth asking the obvious question — the one a child would ask. If the evidence is this strong, if a taxi driver in Singapore can see it, if the machines have been consistent for thirty-five years and passed a thirty-year test — why the denial? Who gains?
The answer is not mysterious. Doubt is cheap to manufacture and enormously valuable to anyone who needs a decade’s delay. The internal research of major fossil-fuel companies, now a matter of public record, shows their own scientists projecting warming with striking accuracy in the 1970s and 1980s, while their public messaging cultivated uncertainty for decades afterwards. Supran, Rahmstorf and Oreskes went back through the projections Exxon and ExxonMobil scientists produced or recorded between 1977 and 2003 and found they had predicted the subsequent warming with substantial skill.[15] The company knew. It had done the maths itself. Delay is a product. Confusion is a product. And the people who buy it are never the ones who pay for it.
Because the bill does not go to the boardroom. It does not go to the think tank or the columnist. It goes to the future — and the future is not an abstraction. It is you and me, and our children, standing in the valley when the river rises nine metres in half an hour.
This isn’t just about glaciers anymore
Which brings me to where I think the argument about climate modelling has gone quietly wrong.
People hear “climate projection” and picture a squabble about what the weather might be like in 2050. Increasingly, these are also economic projections. Climate is becoming an input into the price of things.
A hotel.
A vineyard.
A ski resort.
A coastal apartment.
A hydroelectric plant.
Agricultural land.
A logistics network.
An insurance portfolio.
A sovereign bond.
A pension fund.
The International Monetary Fund has warned that physical climate risk may not yet be fully reflected in global equity valuations, and that a sudden reassessment could drive falls in asset values, transmitting the shock into portfolios and financial institutions.[25]
It is already visible in property. European Central Bank research published in 2025 found investors applying a price penalty to commercial buildings exposed to physical climate risk — a penalty that grew significantly between 2007 and 2023.[26]
This is where climate science walks quietly into wealth management. A thirty-year investment horizon and a thirty-year climate projection are, it turns out, talking about the same thirty years. For anyone buying assets intended to fund a retirement in 2055, climate modelling is no longer environmental philosophy.
It is due diligence.
Follow the snow
Consider skiing. It sounds almost indecent to mention beside hundreds of deaths in Nepal. Economically, it isn’t trivial at all.
A 2023 study in Nature Climate Change modelled 2,234 ski resorts across 28 European countries. Without artificial snowmaking, 53% would face very high snow-supply risk in a world warmed by 2°C. At 4°C, the figure rose to 98%. Snowmaking helps, but does not rescue the situation — and it demands water and electricity at precisely the moment both may be in shorter supply.[27]
Now think about what sits behind the ski lift.
Hotels.
Restaurants.
Property.
Equipment rental.
Airports.
Roads.
Seasonal employment.
Mortgages.
Municipal tax revenues.
Insurance.
Energy infrastructure.
The mountain will still be there. The economy built around dependable snow may not be.
And that, precisely, is the pattern Peter was warning about.
Temperature is the input.
Everything connected to it becomes part of the output.
The belts around the Earth are moving too
There is a larger system still, and it is worth looking at the whole globe for a moment.
Find the Tropic of Cancer and the Tropic of Capricorn. The lines themselves are astronomical markers at roughly 23.5° north and south; they do not control the weather. But they sit close to one of the most important climatic regions on Earth: the subtropical belts, where the descending arms of the vast Hadley circulation come back to the surface.
The mechanism is lovely in its simplicity. Warm, moist air rises at the tropics. It moves poleward high in the atmosphere. Then, broadly, it sinks again in the subtropics — and sinking air is dry air. It is no accident that so many of the planet’s great deserts sit at these latitudes. They are, in a sense, the exhaust of the tropics.
Climate models have long said that these cells and their dry zones would shift as the planet warmed. And once again, we have been able to compare model with observation.
The IPCC’s latest physical-science assessment concludes that the Hadley cells are projected to expand poleward with warming, with particularly high confidence in the Southern Hemisphere. The precise consequences for rainfall in each individual region remain more uncertain — a qualification worth keeping — but the large-scale movement of the circulation is a well-established one.[28] The IPCC also finds high confidence in aridification across regions including the Mediterranean, Central America and southern Africa, with drought risk rising elsewhere as warming continues.[28]
This matters economically because rain is infrastructure.
Move rainfall and you move agriculture.
Move drought risk and you move food prices.
Move storm tracks and you change reservoirs.
Move reliable water and populations, eventually, follow it.
Which means the economic consequences of climate change will not arrive neatly labelled CLIMATE LOSS on a balance sheet. They will appear wearing other clothes.
Lower agricultural productivity.
Higher food prices.
Insurance withdrawal.
Falling property values.
Water restrictions.
Energy shortages.
Broken tourist seasons.
Supply-chain interruptions.
Migration.
Sovereign expenditure.
Credit losses.
Some of the most consequential climate events of the next thirty years may never look like climate events at all.
They will look like economics.
The real test of the warning
This is why the history matters.
A Cray in 1991 could not model the world with anything like today’s detail. HMS Endurance could gather a few hundred observations in a season where satellites now supply continuous streams. The grid cells were enormous. The uncertainties were enormous.
And yet the underlying physical proposition survived.
Greenhouse gases increased.
The planet accumulated heat.
Global temperature rose.
Glaciers retreated.
Sea level rose.
Heat extremes intensified.
The hydrological cycle began changing.
When scientists went back to the old projections and set them beside reality, the remarkable finding was not how badly the primitive computers had failed. It was how much they had got right.[22]
None of which means every forecast made today will come true. Models are not prophecy. Regional rainfall is harder than global temperature. Clouds are hard. Ice-sheet dynamics carry major uncertainties. Human behaviour may change emissions dramatically in either direction. There will be surprises, and some of them will be unpleasant.
But we should be very careful about drawing the wrong lesson from uncertainty.
Thirty years ago the machines were crude and the warning was broad. Today the machines are vastly more powerful, the observations vastly richer, the models vastly more detailed. And crucially: we now know the earlier generation passed a test it could not possibly have been tuned to pass.
The future happened.
We measured it.
And much of the broad signal was there.
So when today’s models tell us what another thirty years may mean for glaciers, drought, rainfall, coastlines, agriculture, tourism, property and wealth, dismissing them because they cannot say which mountain will collapse on which morning is to misunderstand what they are for.
Peter’s generation wasn’t predicting the headline.
They were predicting the system in which the headline would eventually be written.
Of course the scientists didn’t know everything. Peter never claimed they did; science doesn’t work that way, and he would have been the first to say so.
What they knew was enough to issue a warning.
And Peter didn’t whisper that warning in private and then hedge his bets in public. In 1999, as the man running the UK Met Office, he put his name underneath it:
Ignoring climate change would be the most costly choice of all.
Nearly three decades later, I look at what has happened in the Himalayas and find myself thinking about him.
Not because Peter predicted this flood. He didn’t.
Not because we can yet state that climate change caused this particular glacier to collapse. We can’t.
But because the world in which a Himalayan glacier can destabilise, drop more than a kilometre into a valley and generate a catastrophic cascade of ice, water, mud and rock is part of a much larger physical system.
And that system is changing.
That was the warning.
Not a date.
Not a location.
Not a newspaper headline.
A direction.
We were warned that if humanity kept changing the atmosphere, eventually the physical systems around us would begin changing in response.
The first computers telling us this occupied rooms.
Their successors became millions of times more powerful.
The measurements accumulated.
The models improved.
The evidence strengthened.
And still we debated.
Peter Ewins warned us nearly thirty years ago.
The computers have changed beyond recognition.
The physics hasn’t.
And now the mountains are changing too.
References
- Reuters. “Hundreds killed, more than 1,000 missing in Nepal and China after Himalayan flood.” 27 August 2026. Current casualty figures, rescue operations and infrastructure destruction.
- Reuters. “What triggered the catastrophic flood on the Nepal-Tibet border?” 26 August 2026. Reconstruction of the glacier collapse and the resulting ice-rock-debris flood.
- Reuters. “Nepal’s fatal flash floods.” 27 August 2026. Satellite evidence, Himalayan glacier loss and expert discussion of climate-related destabilisation.
- Royal Meteorological Society. “Remembering James Milford and Peter Ewins.” 24 January 2025. Confirms Peter Ewins as Chief Executive of the Met Office from 1997 until his retirement in 2004.
- Ewins, Peter D., and D. James Baker. “Letter — global warming.” The Independent, December 1999. Joint warning by the heads of the UK Met Office and US NOAA concerning anthropogenic warming, extreme weather, sea-level rise, changing precipitation and other consequences. Includes the statement — “Ignoring climate change will surely be the most costly of all possible choices, for us and our children.”
- Met Office National Meteorological Library and Archive. “Photograph of Peter D Ewins F.Eng.” Archive reference MET/4/2/1/4a/1. Confirms Ewins as Met Office Chief Executive, 1997–2004.
- UK House of Commons, Hansard. Written Answers, 15 March 1991. Records HMS Endurance spending approximately 100 days in or near Antarctic waters during the 1989–90 season, logging 350 sets of meteorological observations subsequently sent to the Met Office. Hansard states that these observations contributed to climate records and, together with other Antarctic observations, were used in weather forecasting and climate prediction.
- Met Office. “History of numerical weather prediction.” Historical account of Met Office computing and current forecasting infrastructure. The present Microsoft Azure-based system entered operation in May 2025, contains approximately 1.8 million compute cores and is capable of more than 60 quadrillion calculations per second.
- Met Office. “HadCM3 — Met Office climate prediction model.” Technical description of the Hadley Centre coupled climate models, including the approximately 2.5° × 3.75° atmospheric grid shared with HadCM2 — around 417 × 278 km at the equator — and their role in climate prediction and attribution research.
- Hausfather, Z., Drake, H. F., Abbott, T., and Schmidt, G. A. “Evaluating the Performance of Past Climate Model Projections.” Geophysical Research Letters, 47, 2020. DOI: 10.1029/2019GL085378. Examined 17 historical climate projections published between 1970 and 2007. Ten were consistent with subsequent observations when comparing temperature through time; after accounting for differences between projected and actual radiative forcing, 14 of 17 were consistent with observations.
- International Centre for Integrated Mountain Development (ICIMOD). Jackson, M. et al. “Consequences of climate change for the cryosphere in the Hindu Kush Himalaya.” Water, Ice, Society, and Ecosystems in the Hindu Kush Himalaya (HI-WISE) assessment. Reports that regional glacier mass loss accelerated by approximately 65%, from −0.17 to −0.28 metres water equivalent per year between the decades beginning in 2000 and 2010, and projects major further glacier loss under continued warming.
- Shugar, D. H. et al. “A massive rock and ice avalanche caused the 2021 disaster at Chamoli, Indian Himalaya.” Science, 2021, eabh4455. DOI: 10.1126/science.abh4455. Reconstruction of the February 2021 Chamoli disaster using satellite imagery, seismic records, numerical modelling and eyewitness video. Approximately 27 million cubic metres of rock and glacier ice detached from Ronti Peak, producing a catastrophic debris flow and killing or leaving missing more than 200 people.
- Destination Earth / ECMWF. “Climate Change Adaptation Digital Twin.” Current European kilometre-scale climate modelling programme. New simulations cover 1990–2049 at approximately 5 km resolution for atmosphere and land, 5–10 km for ocean and sea ice, with hourly temporal resolution.
- Met Office and Alan Turing Institute. “New research shows AI can produce trustworthy, physically realistic weather forecasts.” 8 July 2026. Describes the FastNet machine-learning weather model, whose forecast accuracy is already comparable with the Met Office Global Model and exceeds it on some metrics.
- Supran, G., Rahmstorf, S., and Oreskes, N. “Assessing ExxonMobil’s global warming projections.” Science, 2023. Analysis of climate projections produced or recorded by Exxon and ExxonMobil scientists between 1977 and 2003. The study found that the company’s internal projections generally predicted subsequent global warming with substantial skill.
- Reuters. “The world’s deadliest glacier disasters.” 27 August 2026. Comparative historical record of major glacier-related disasters, including the 2021 Chamoli event and earlier catastrophic avalanches and glacial floods.
- Met Office. Archive material on the Unified Model and early Hadley Centre computing — the Cray Y-MP-8 that took the Unified Model operational in June 1991 at roughly one billion calculations per second, and the second Cray funded by the Department of the Environment the following year for the Hadley Centre’s climate work.
- British Antarctic Survey. Account of the 1997–98 traverse of the Ronne Polynya in the Weddell Sea by HMS Endurance, and the sea-ice, oceanographic and meteorological measurements gathered for use alongside satellite data in numerical modelling experiments.
- WIRED. Reported remarks by Peter Ewins, then Chief Executive of the Met Office, to the BBC — that the evidence for a human influence on climate was becoming almost incontrovertible and that society needed to act.
- Hansen, J., Fung, I., Lacis, A., Rind, D., Lebedeff, S., Ruedy, R., Russell, G., and Stone, P. “Global climate changes as forecast by Goddard Institute for Space Studies three-dimensional model.” Journal of Geophysical Research — Atmospheres, 93(D8), 1988. A grid of roughly 8° latitude by 10° longitude, projecting that greenhouse warming would become clearly detectable during the 1990s.
- IPCC. Climate Change — The IPCC Scientific Assessment, First Assessment Report, 1990. Business-as-usual projection of warming of about 0.3 °C per decade, with a stated range of 0.2 °C to 0.5 °C.
- IPCC. Fourth Assessment Report, Working Group I, 2007 — historical overview of climate change science. Compares the first and second assessments’ projections for 1990–2005, roughly 0.15 °C to 0.3 °C per decade, with an observed rate of about 0.2 °C per decade, and concludes that the comparison strengthens confidence in near-term projections.
- Review of quantum computing applications in weather and climate modelling. Environmental Data Science, 2025. Sets out the plausible applications — differential equations, sub-grid processes, parameter optimisation, ensemble analysis — alongside the unsolved problems of hardware, error, data encoding, read-out and integration with classical machines.
- Palmer, T. N. and colleagues. On the prospects for quantum computing in weather and climate prediction. Bulletin of the American Meteorological Society. Argues that quantum machines are unlikely to replace classical forecasting supercomputers, and that their plausible role is as specialists inside a larger heterogeneous system.
- International Monetary Fund. Global Financial Stability Report — analysis of physical climate risk and equity valuations, warning that the risk may not yet be fully priced and that a sudden reassessment could transmit shocks into portfolios and financial institutions.
- European Central Bank. Research published 2025 on the pricing of physical climate risk in European commercial real estate, finding a price penalty on exposed buildings that grew significantly between 2007 and 2023.
- François, H., Samacoïts, R., Bird, D. N., Köberl, J., Prettenthaler, F., and Morin, S. “Climate change exposure and vulnerability of the European ski industry.” Nature Climate Change, 13, 2023. Modelled 2,234 ski resorts across 28 European countries. Without artificial snowmaking, 53% face very high snow-supply risk at 2 °C of warming, rising to 98% at 4 °C.
- IPCC. Sixth Assessment Report, Working Group I, 2021. Projects poleward expansion of the Hadley cells with warming, with particularly high confidence in the Southern Hemisphere, and high confidence in aridification across regions including the Mediterranean, Central America and southern Africa.